By: Sagar Mahurkar, Findability Sciences
An operating manager of a sugar plant typically has twenty to thirty years of experience in the mill. They can tell the concentration of juice by touch and estimate the flow by sight. The best managers don’t necessarily have the best recovery or production on a regular day, but they have the fewest panics. An agronomy head, similarly, is not measured on guessing the right day to cut the cane, but on avoiding losses due to weeds, poor nutrition, or incorrect irrigation. The objective in sugar and ethanol manufacturing has always been to reduce the losses that bad days take out of the maximum potential. This is often referred to as process stabilization.
Let’s look at the graph below. You will see losses in the field due to late weeding, mistimed irrigation, and asynchronous nutrition. At harvest, further losses from cuts outside the window, trash in the cane, and cut-to-crush delay. In the factory, unplanned stoppages, chronic losses from micro stops, and rework due to low quality. What remains is realized as sugar, ethanol, and bagasse used to generate power.
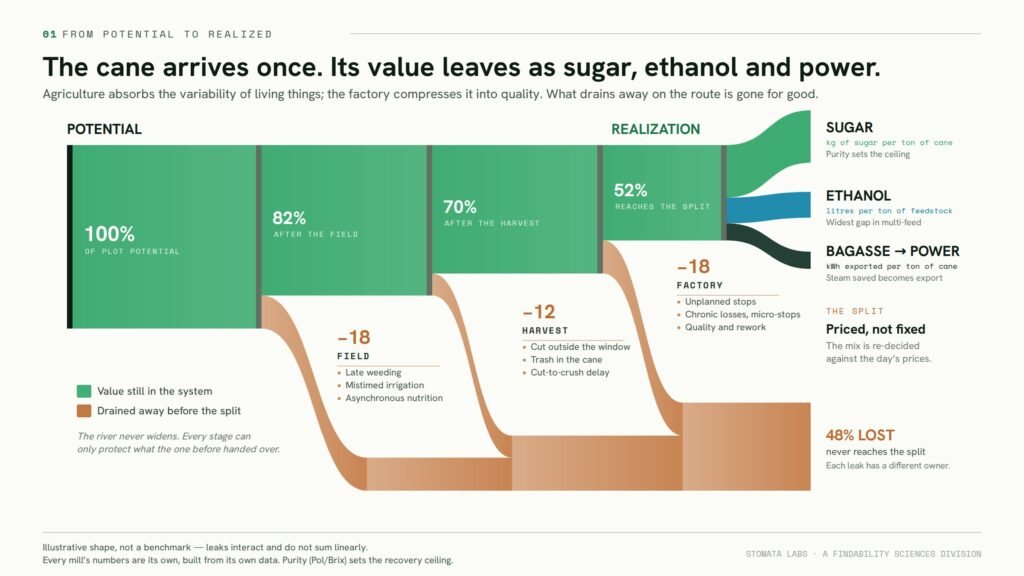
Figure: the cane stream from potential to realized. Losses accumulate in the field, at harvest and in the factory, and the value that survives leaves as sugar, ethanol and the bagasse used to generate power. Illustrative shape only, not a benchmark.
That distance between potential and realized is the real measure of a mill. The field and harvest stages belong to the agronomy head, the factory to the operating manager, and historically it surfaced only when the season’s accounts were closed.
For a century that work has been done with rules: a manual, a set-point sheet, a veteran’s judgement. But rules are written for typical days, and the losses above arrive together. Closing it with data is what we do at Stomata Labs, the Findability Sciences division for sugar: stabilize first, then optimize. Optimize a swinging process, and the swing only moves elsewhere.
Stabilizing the process
Stabilization begins with detection. A plant generates thousands of readings a shift; nobody can hold them all at once, and an alarm limit reports an excursion only after it has happened.
What AI changes is the definition of abnormal. Attention-based models, the same mechanism behind large language models, learn which variables matter to which others and how that shifts with context. Lapse time, imbibition, clarifier pH, a purity reading from two hours ago: weighed together, in combinations no control room could watch.
Detection alone is noise. The useful step names the probable cause and prices the consequence in kilograms of sugar per hour and rupees. A rise in pol-in-cake arriving as “probable mud-pump cavitation, projected loss X kg/hour, check the pump” can be acted on within the shift. The same event as three amber lights is homework.
Who is in charge does not change: the system recommends, the operator acts, the manager reviews. Thirty years of instinct is not replaced; it gains a wider field of view.
Then optimizing
Stabilization is about the bad days; it is the discipline behind the fewest panics. Optimization is about the regular day. Once the process holds its set-points, the system can recommend imbibition, lime dosing, vapour bleeding, centrifuge cycle, and the split itself: how much cane value leaves as sugar and how much as ethanol at that day’s prices. A commercial decision, taken as a set-point.
For Indian mills this is already live. With ethanol blending near 20 per cent and over three million tonnes of sugar diverted this season, a mill with a distillery is running a portfolio.
Proof of method
We have applied this at 15 mills in seven countries. At Pantaleon, the anchor operation, the 2025 season produced two statistically validated results, both in the factory stage.
Global recovery moved from 81% to 83%. That is the share of sucrose arriving at the factory that leaves as sugar, not sugar-on-cane, worth roughly two extra kilograms per tonne. Over the season the distance between ideal and actual operation narrowed by 41 per cent.
Lost time closed the season at 0.03% against a 0.26% target, down from 0.57% in earlier years.
Those are one group’s numbers, on one group’s cane. Every mill’s gap is its own, provable only with its own data; what transfers is the method. What is new is when the gap shows: during the shift, while somebody can still do something about it!